2305 - 290 Adelaide St W
Listing History
Unit Highlights
Utilities Included
Utility Type
- Air Conditioning
- Central Air
- Heat Source
- Gas
- Heating
- Forced Air
Room Dimensions
About this Listing
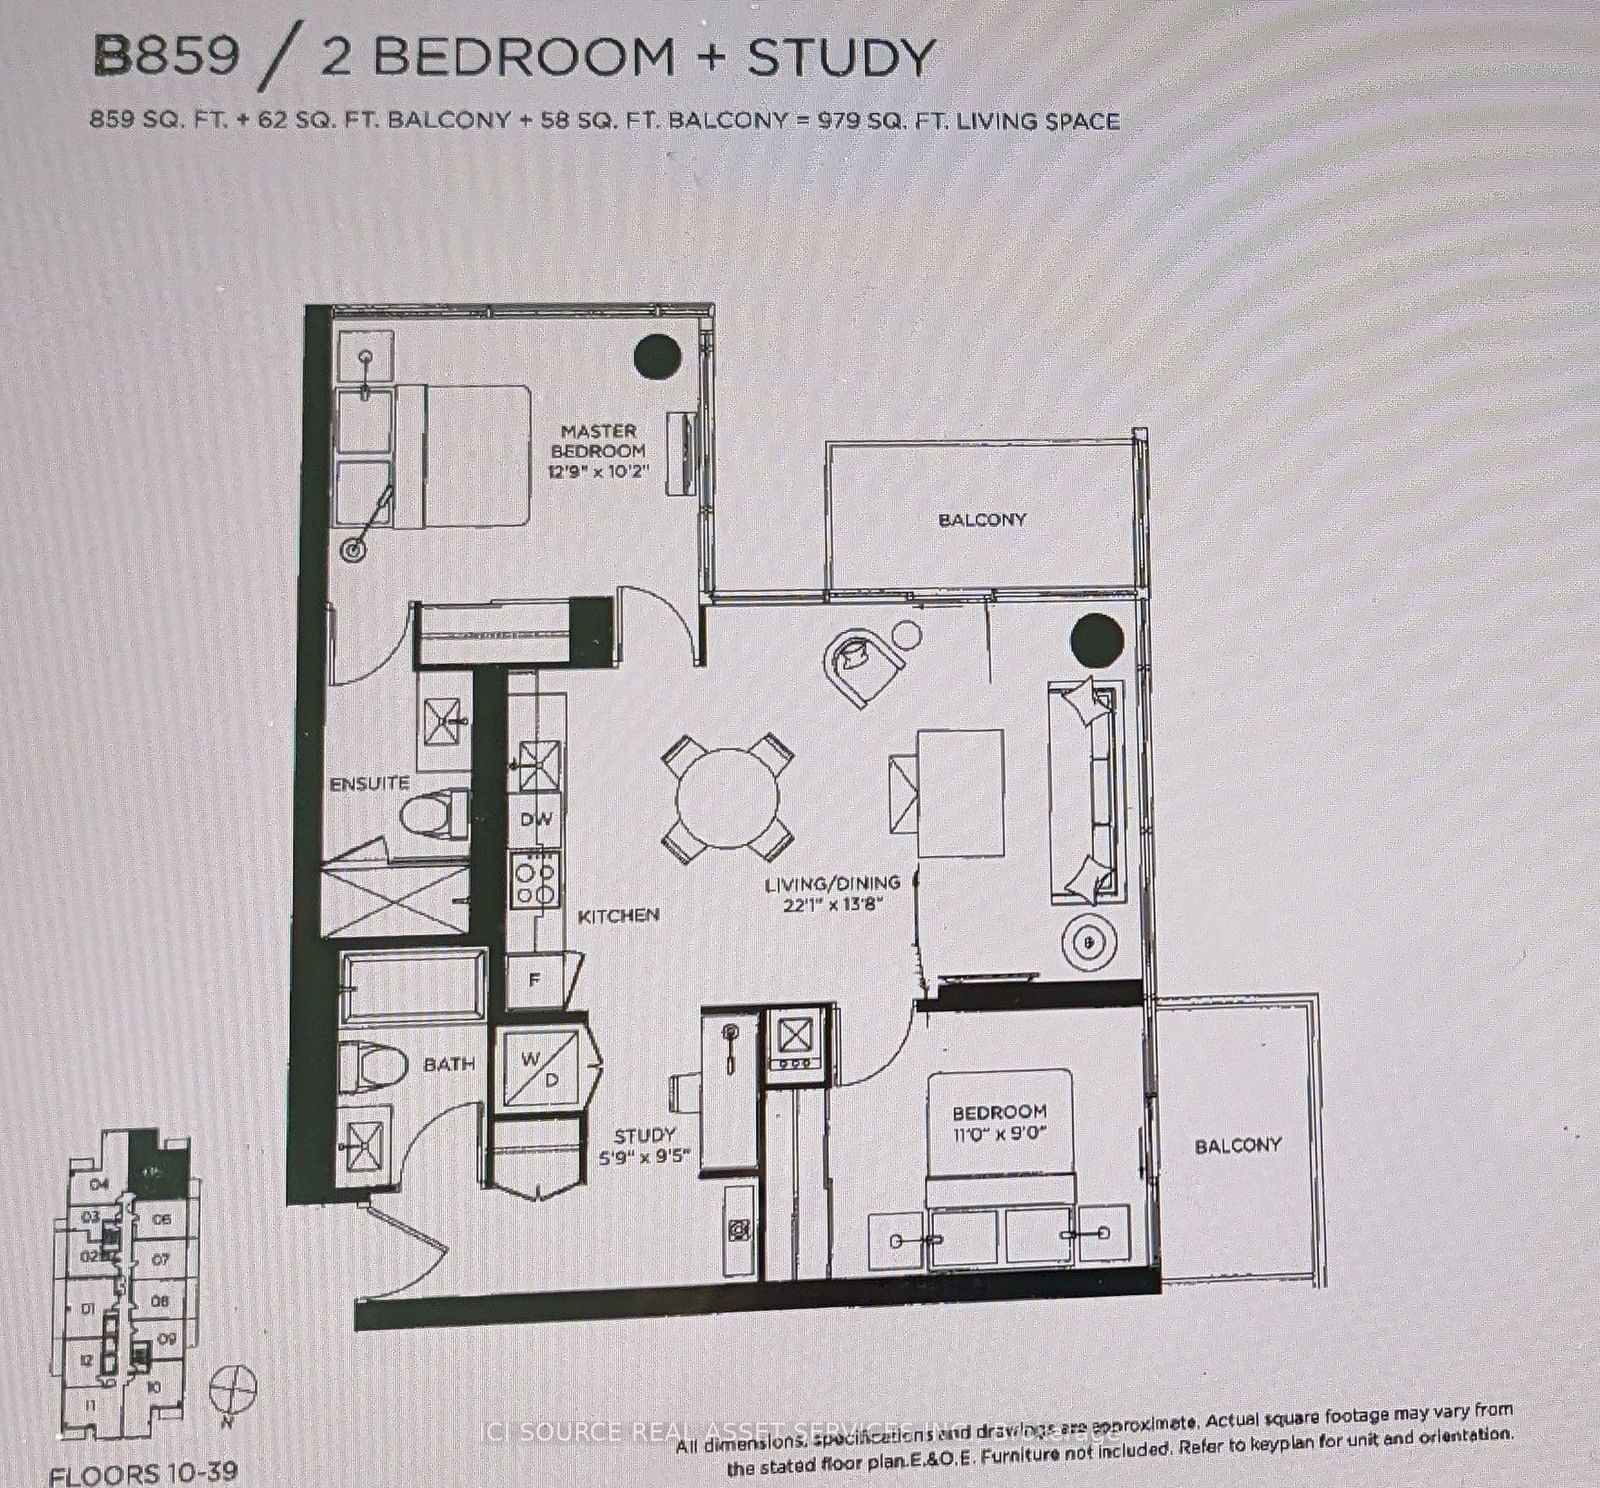
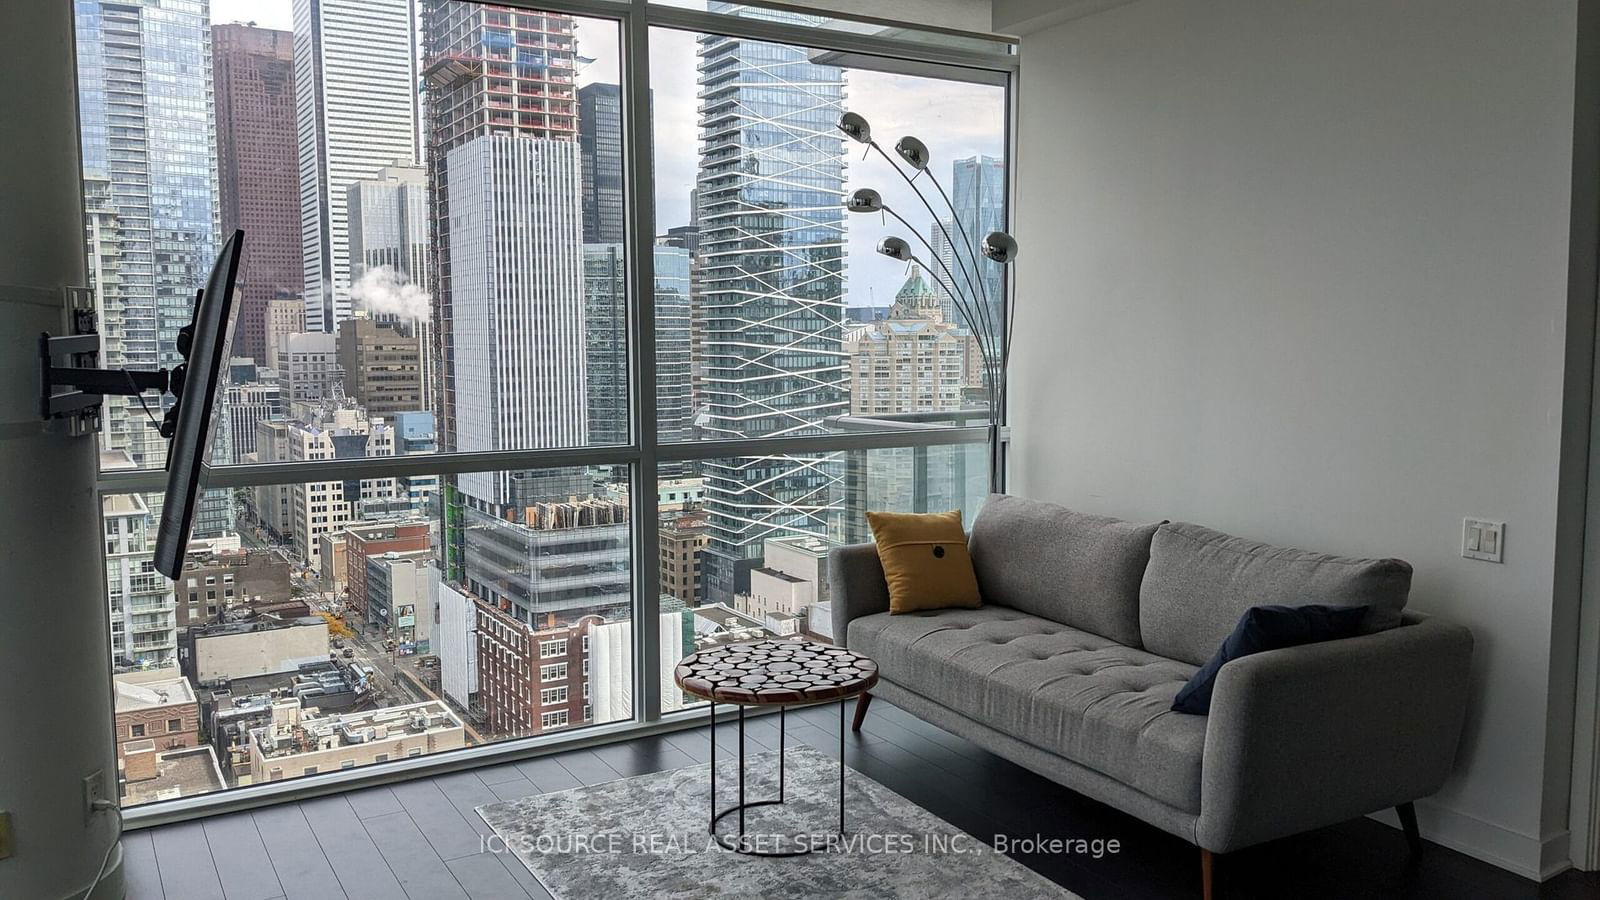
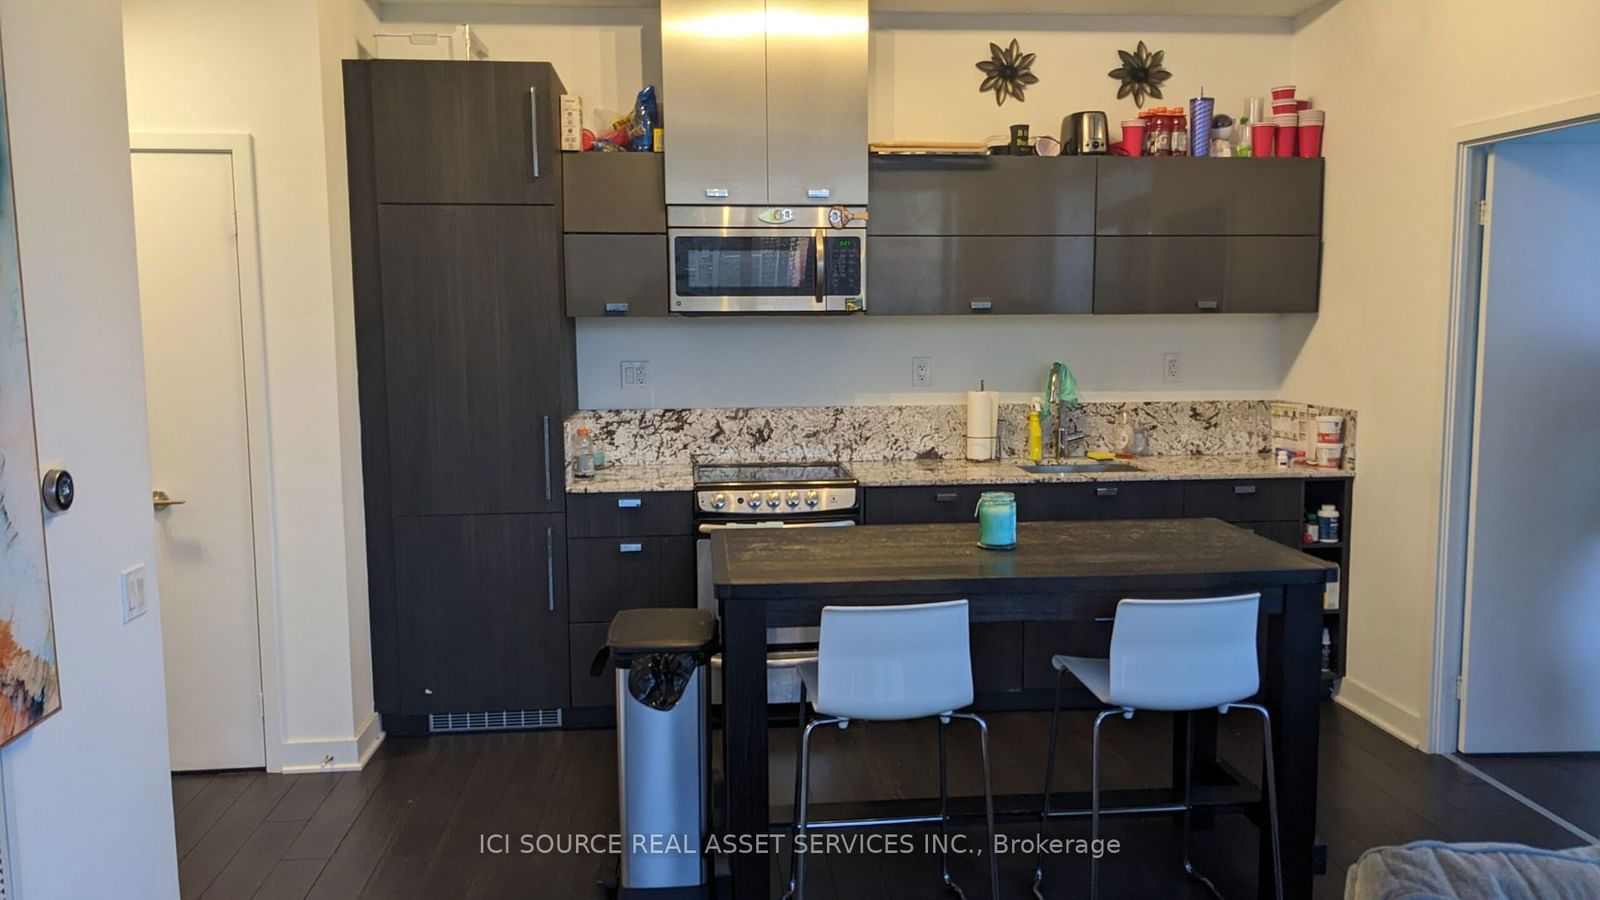
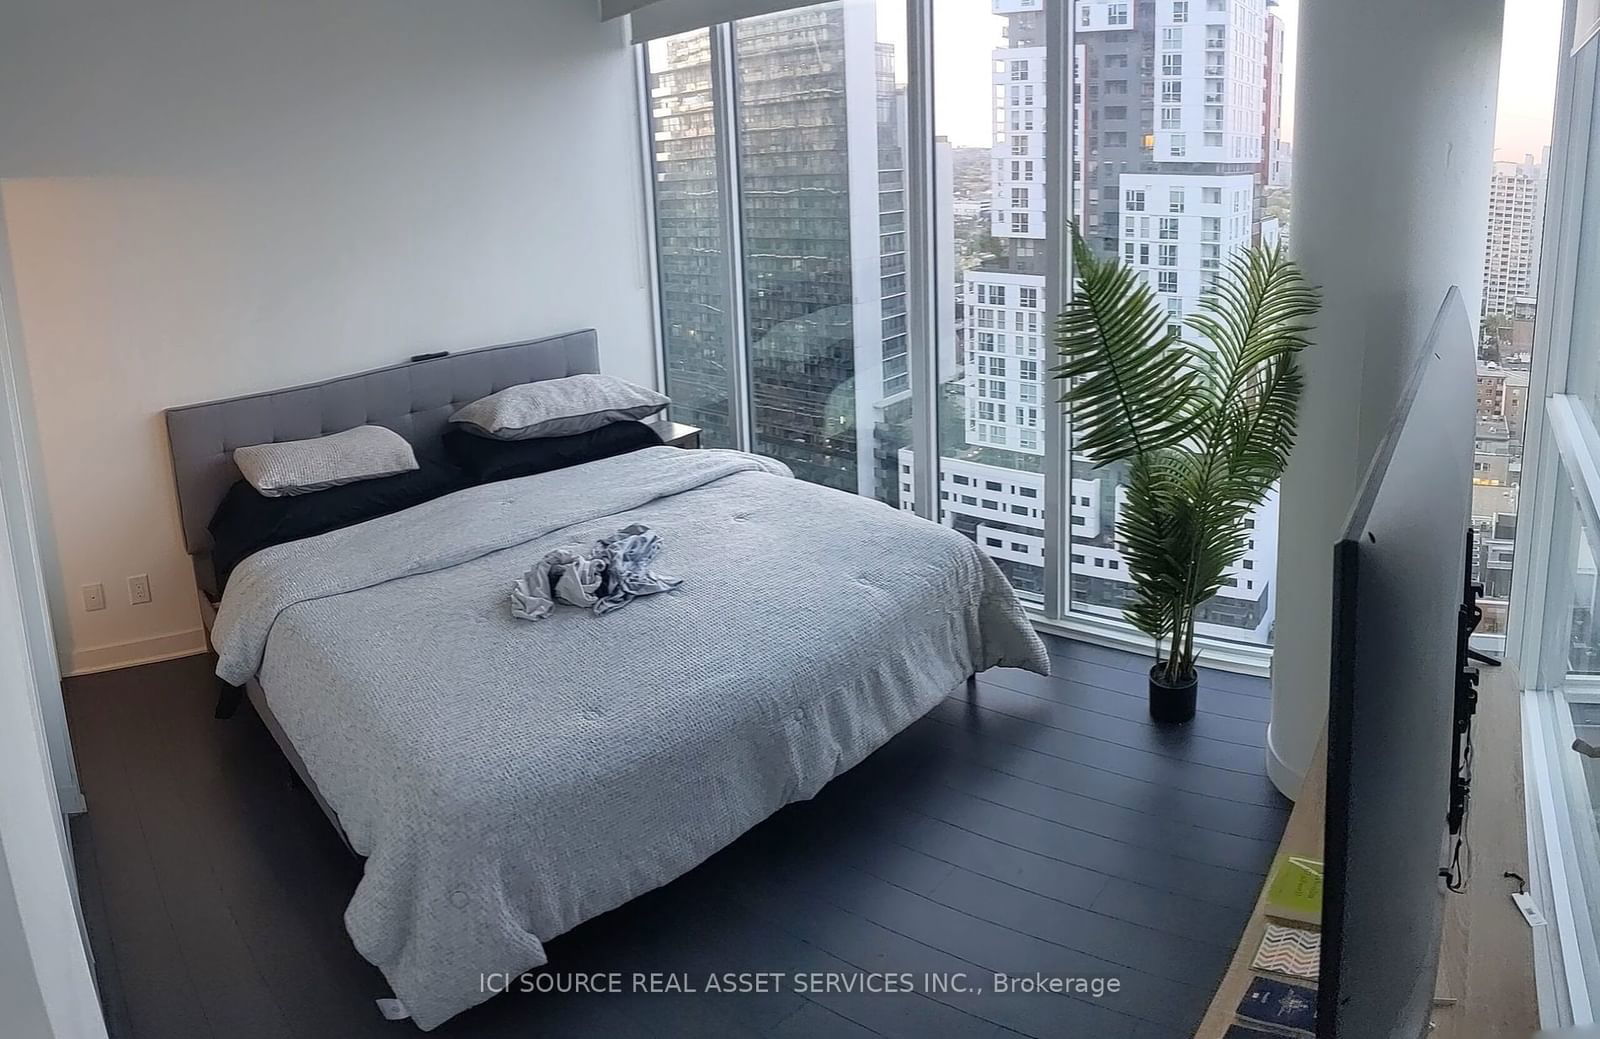
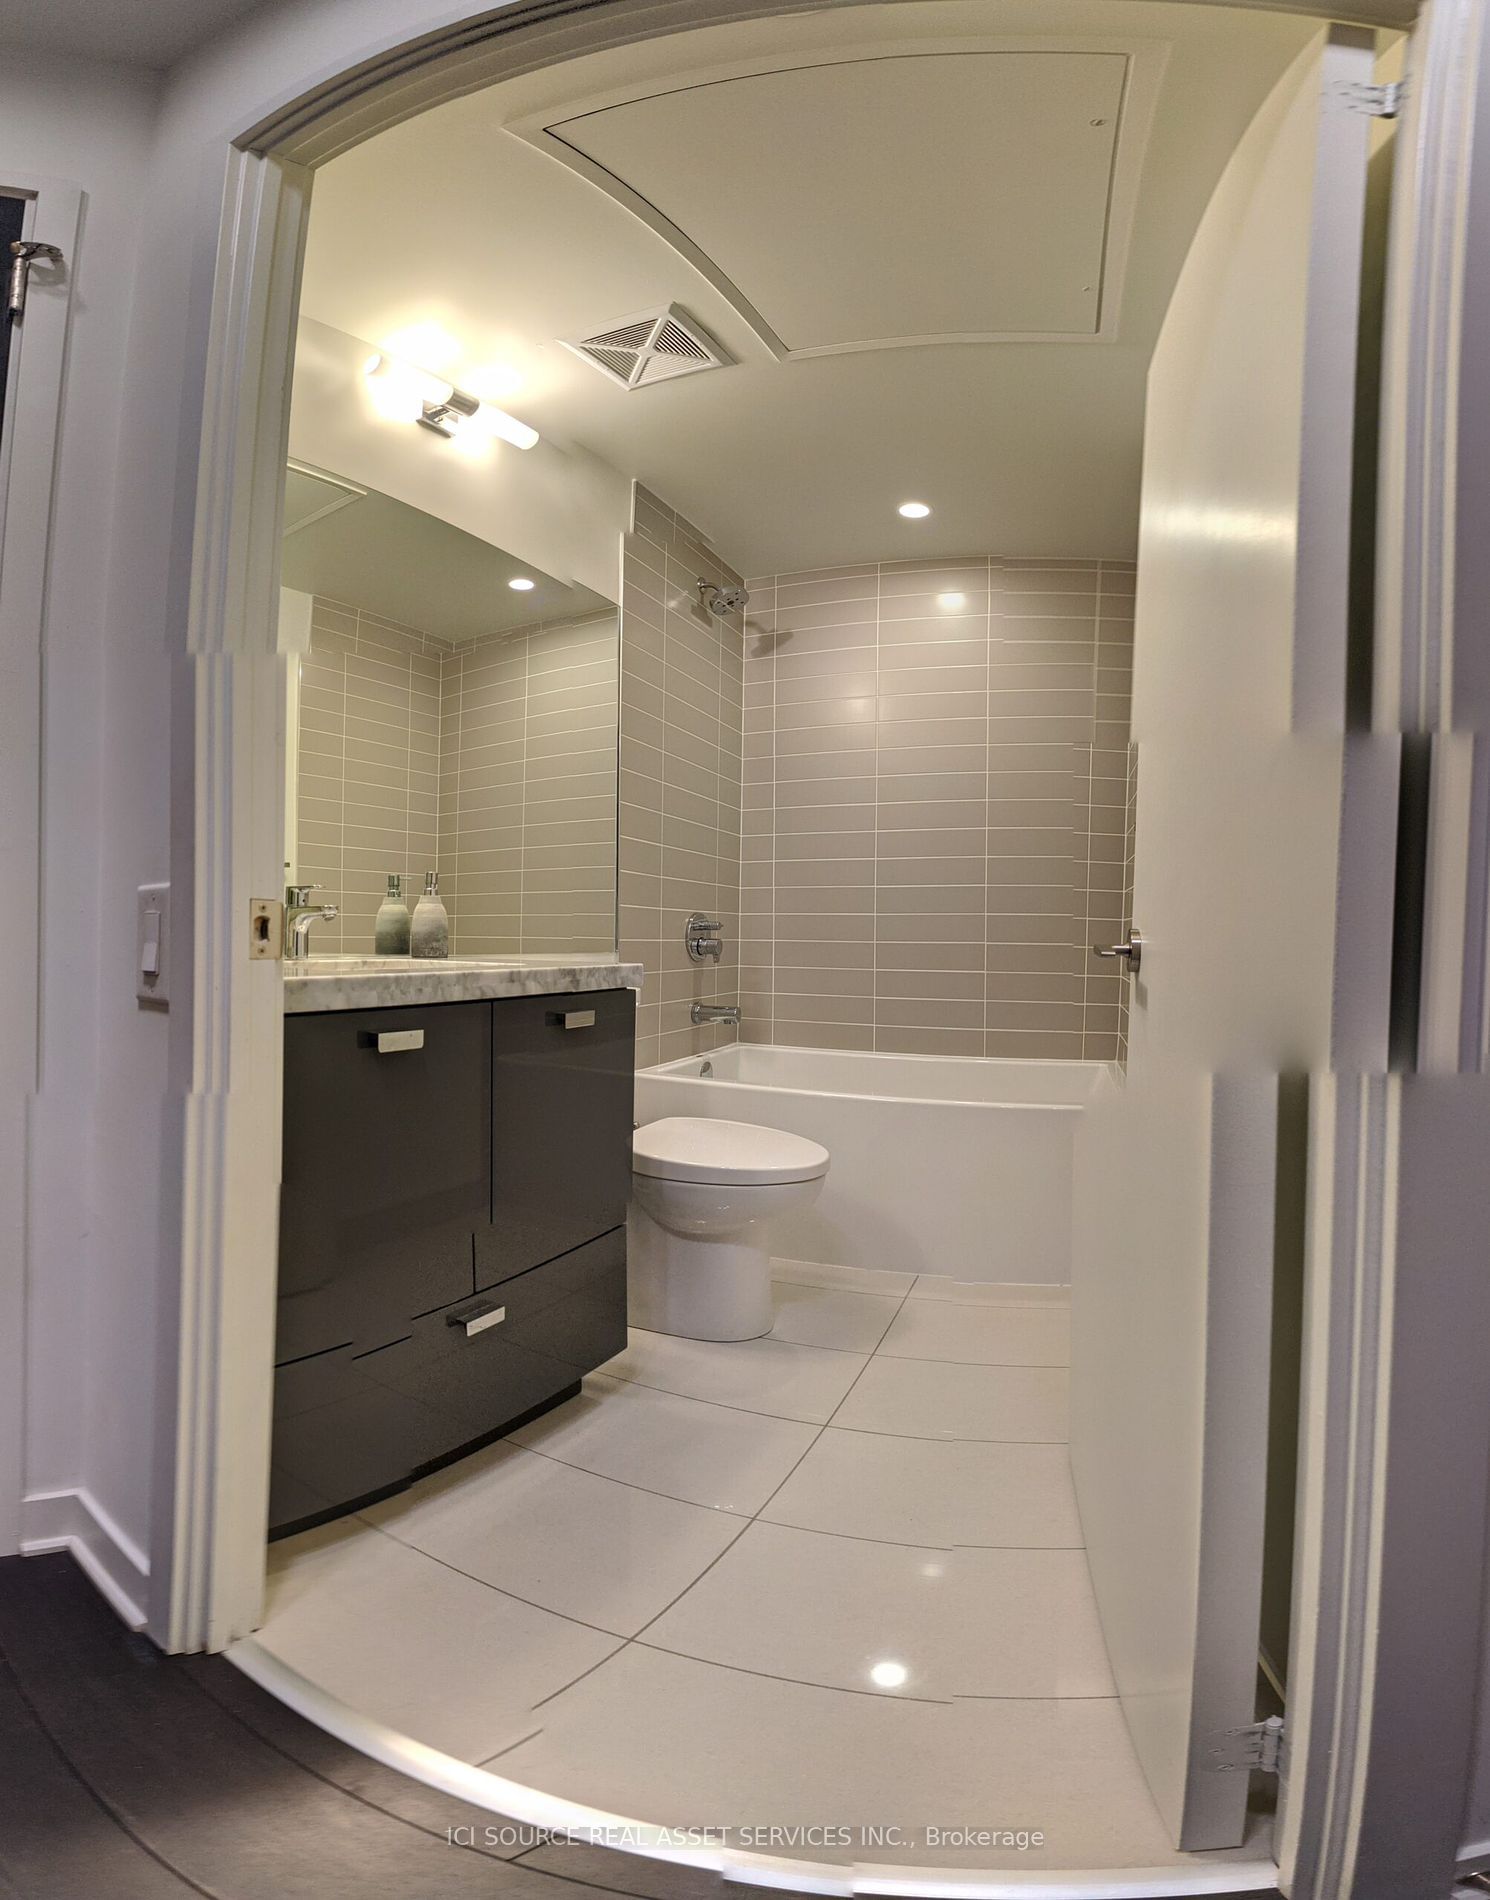
Modern 2-bedroom plus Den, 2-bathroom corner suite at the Luxurious Bond Condo in the heart of the Entertainment District! Spacious & functional split bedroom layout 859 sf + 2 large balconies. Tons of natural light, 9 ceilings with floor-to-ceiling windows, unobstructed East and North facing views of Toronto. Modern open-concept kitchen, hardwood floors throughout, and 1 large storage locker. One of the best locations Downtown with everything at your doorstep: restaurants, financial district, theatres, the PATH, shops, TTC & more! Parking avail for rent in condo.
Extras*For Additional Property Details Click The Brochure Icon Below*
ici source real asset services inc.MLS® #C9510644
Amenities
Explore Neighbourhood
Similar Listings
Demographics
Based on the dissemination area as defined by Statistics Canada. A dissemination area contains, on average, approximately 200 – 400 households.
Price Trends
Maintenance Fees
Building Trends At The Bond Condos
Days on Strata
List vs Selling Price
Offer Competition
Turnover of Units
Property Value
Price Ranking
Sold Units
Rented Units
Best Value Rank
Appreciation Rank
Rental Yield
High Demand
Transaction Insights at 290 Adelaide Street W
| Studio | 1 Bed | 1 Bed + Den | 2 Bed | 2 Bed + Den | 3 Bed | 3 Bed + Den | |
|---|---|---|---|---|---|---|---|
| Price Range | No Data | $520,000 - $559,900 | $625,000 - $758,000 | $742,000 - $880,000 | No Data | No Data | No Data |
| Avg. Cost Per Sqft | No Data | $1,297 | $1,207 | $1,124 | No Data | No Data | No Data |
| Price Range | $2,000 - $2,200 | $2,200 - $2,650 | $2,450 - $3,300 | $2,800 - $4,200 | $3,950 | $4,000 | No Data |
| Avg. Wait for Unit Availability | 140 Days | 55 Days | 57 Days | 54 Days | 344 Days | No Data | No Data |
| Avg. Wait for Unit Availability | 36 Days | 11 Days | 19 Days | 16 Days | 218 Days | 514 Days | No Data |
| Ratio of Units in Building | 9% | 35% | 23% | 30% | 4% | 2% | 1% |
Transactions vs Inventory
Total number of units listed and leased in Queen West

